Mapping the New Politics of Care: Inequality and Vaccine Redistribution Within Phase 1a
All people in the United States have been granted the right to have access to free, safe, and effective COVID-19 vaccines.1 But due to the limited doses available, states have enacted policies prioritizing specific groups based on reasonable—but subjective—weighing of scientific, practical, and ethical evidence and values.
The goal of this map is to examine how prioritizing different groups for vaccination shifts the terrain of vaccine allocation and impacts which communities are protected first.2
The federal government, through Operation Warp Speed, is responsible for purchasing and distributing COVID-19 vaccines to states (and other jurisdictions and agencies).3 As supplies are limited, the federal government is distributing vaccines to states in direct proportion to their adult population.4 While there is no binding rule on how states (and other jurisdictions and agencies) should allocate limited vaccines, so far the majority of states have followed the Centers for Disease Control’s (CDC’s) Advisory Committee on Immunization Practices (ACIP) COVID-19 Vaccines Work Group recommendations.5
ACIP’s vaccine prioritization recommendations are made with the following goals: Decrease death and serious disease as much as possible Preserve functioning of society Reduce the extra burden COVID-19 is having on people already facing disparities 6,7,8
ACIP determined that in Phase 1a, the first groups to be prioritized should consist of health-care personnel and long-term care facility residents. In its guidance, ACIP was explicit in citing evidence that prioritizing Phase 1a groups would mitigate health inequities due to “the disproportionate representation of racial and ethnic minority groups” among low-wage health-care personnel and that the lowest-rated long-term care facilities “are more likely to serve patients experiencing social or economic disadvantage and are more likely to have COVID-19-associated outbreaks.” 9
It is in the spirit of ACIP’s efforts to mitigate health inequities that we set parameters for our map.
Based on the prioritization recommendation of the National Academies of Sciences, Engineering, and Medicine Committee on Equitable Allocation of Vaccine for the Novel Coronavirus, we have used the CDC’s Social Vulnerability Index (SVI) to identify areas as vulnerable.10
The map enables the comparison of four COVID-19 vaccine allocation scenarios at the county level.
- Adult population
An extension of the federal government’s vaccine distribution rationale from the state level to the county level - Phase 1a
ACIP’s prioritization of health-care personnel and long-term care facility residents - Phase 1a weighted by SVI (incl. race/ethnicity)
Suballocation within Phase 1a by CDC’s Social Vulnerability Index - Phase 1a weighted by SVI (excl. race/ethnicity)
Suballocation within Phase 1a by CDC’s Social Vulnerability Index (excl. race/ethnicity)
These comparisons highlight the trade-offs of competing strategies: between each pair of maps, you will see the respective number of vaccine doses allocated to each county and therefore which populations and communities are protected first.
As we switch between the various allocation methods, the number of doses allocated will vary by county but the total number of vaccines distributed to the state will remain the same.


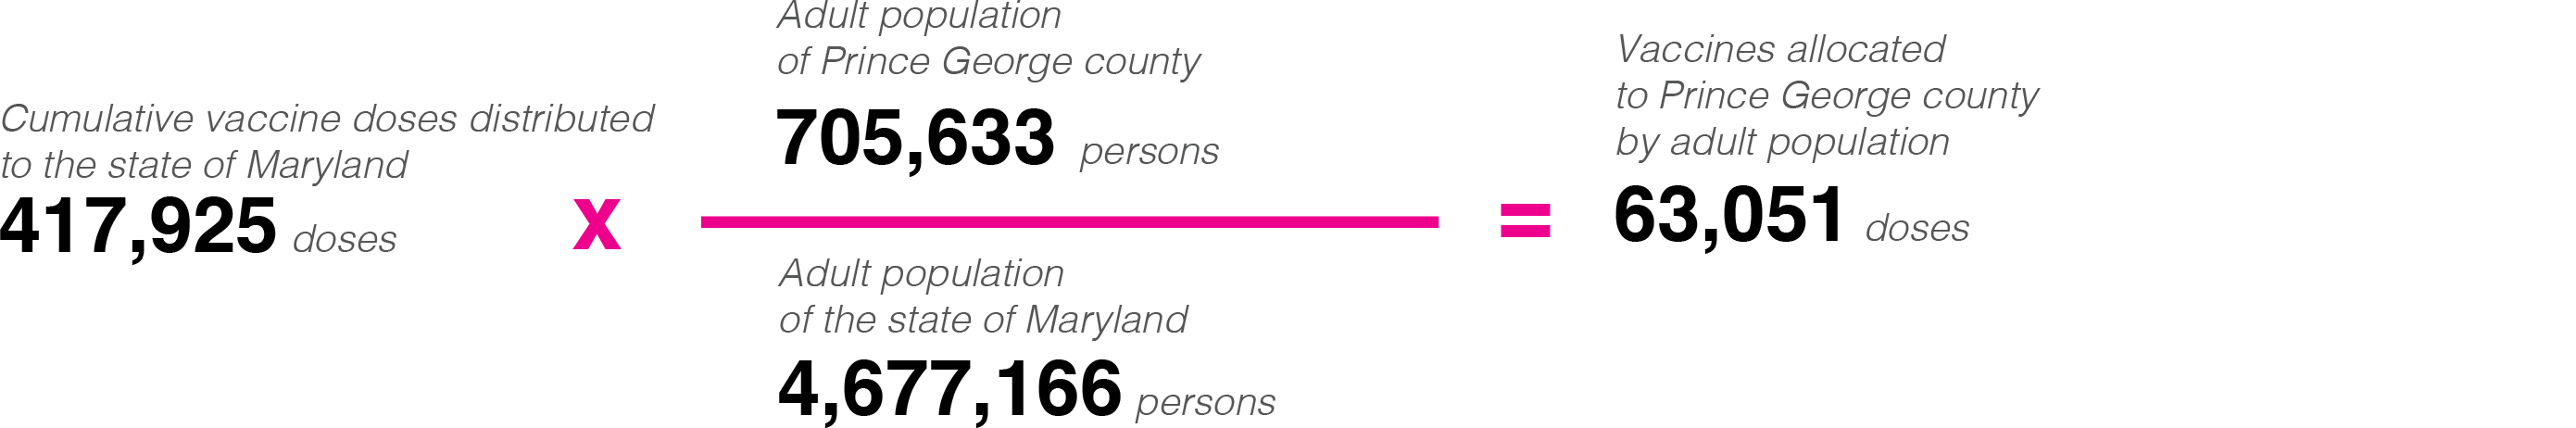
As of January 18th, Maryland had been allocated 417,925 first doses, or enough to cover ~9.0% of its estimated adult population of 4,677,166. Selecting Prince George’s County, a suburb of Washington DC and the county with second largest population in Maryland, illustrates our points about equity in allocation:
Adult Population
If vaccines were distributed in proportion Proportional to the county’s adult population, Prince George’s would be allocated 63,051 doses (~15.1% of the state’s total doses).
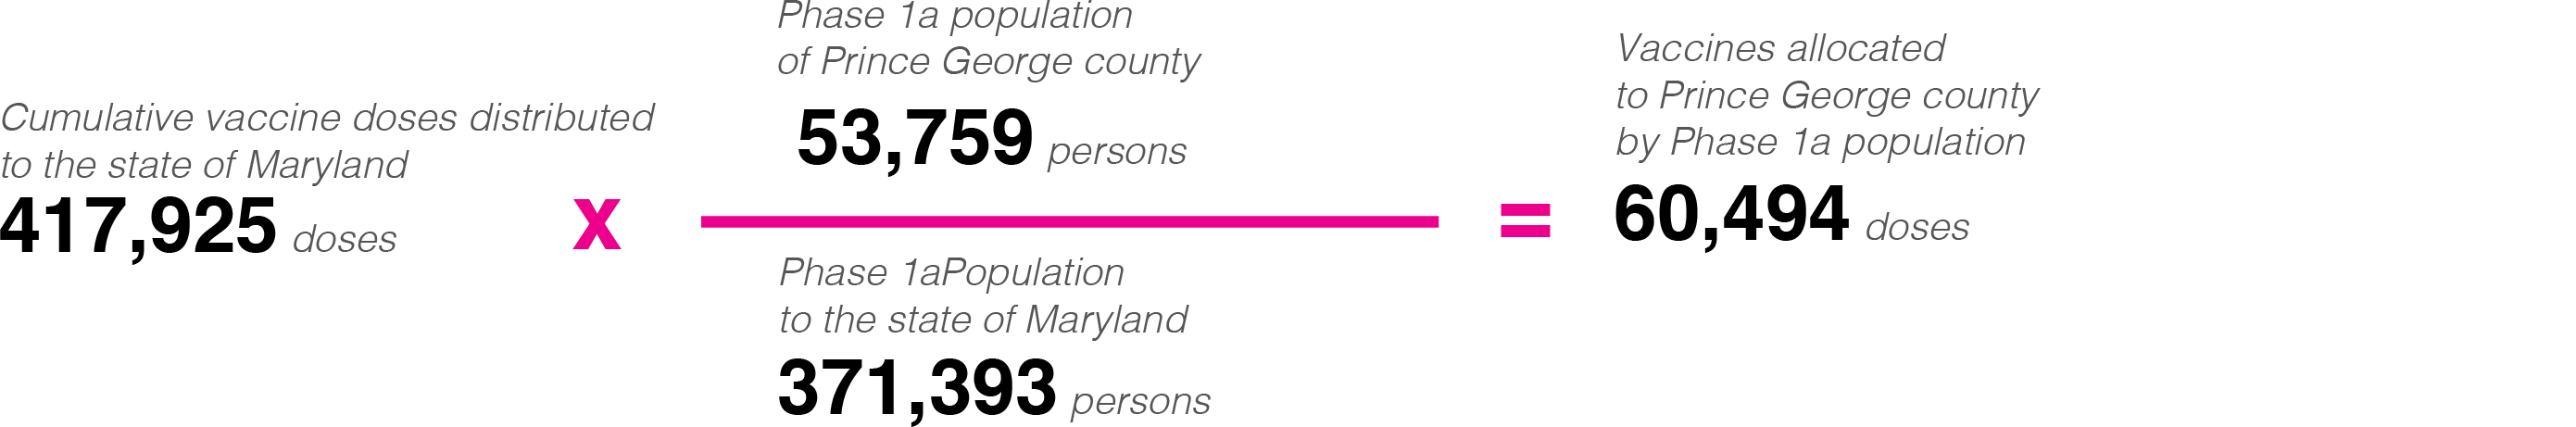
Phase 1a
If instead vaccines were distributed in proportion Proportional to the county’s Phase 1a population, Prince George’s would be allocated just 60,494 doses (~14.5%). Compared to allocating by the adult population, using the allocating by Phase 1a population would decrease the county’s allotment by 2,556 doses (a change of -4.1%).
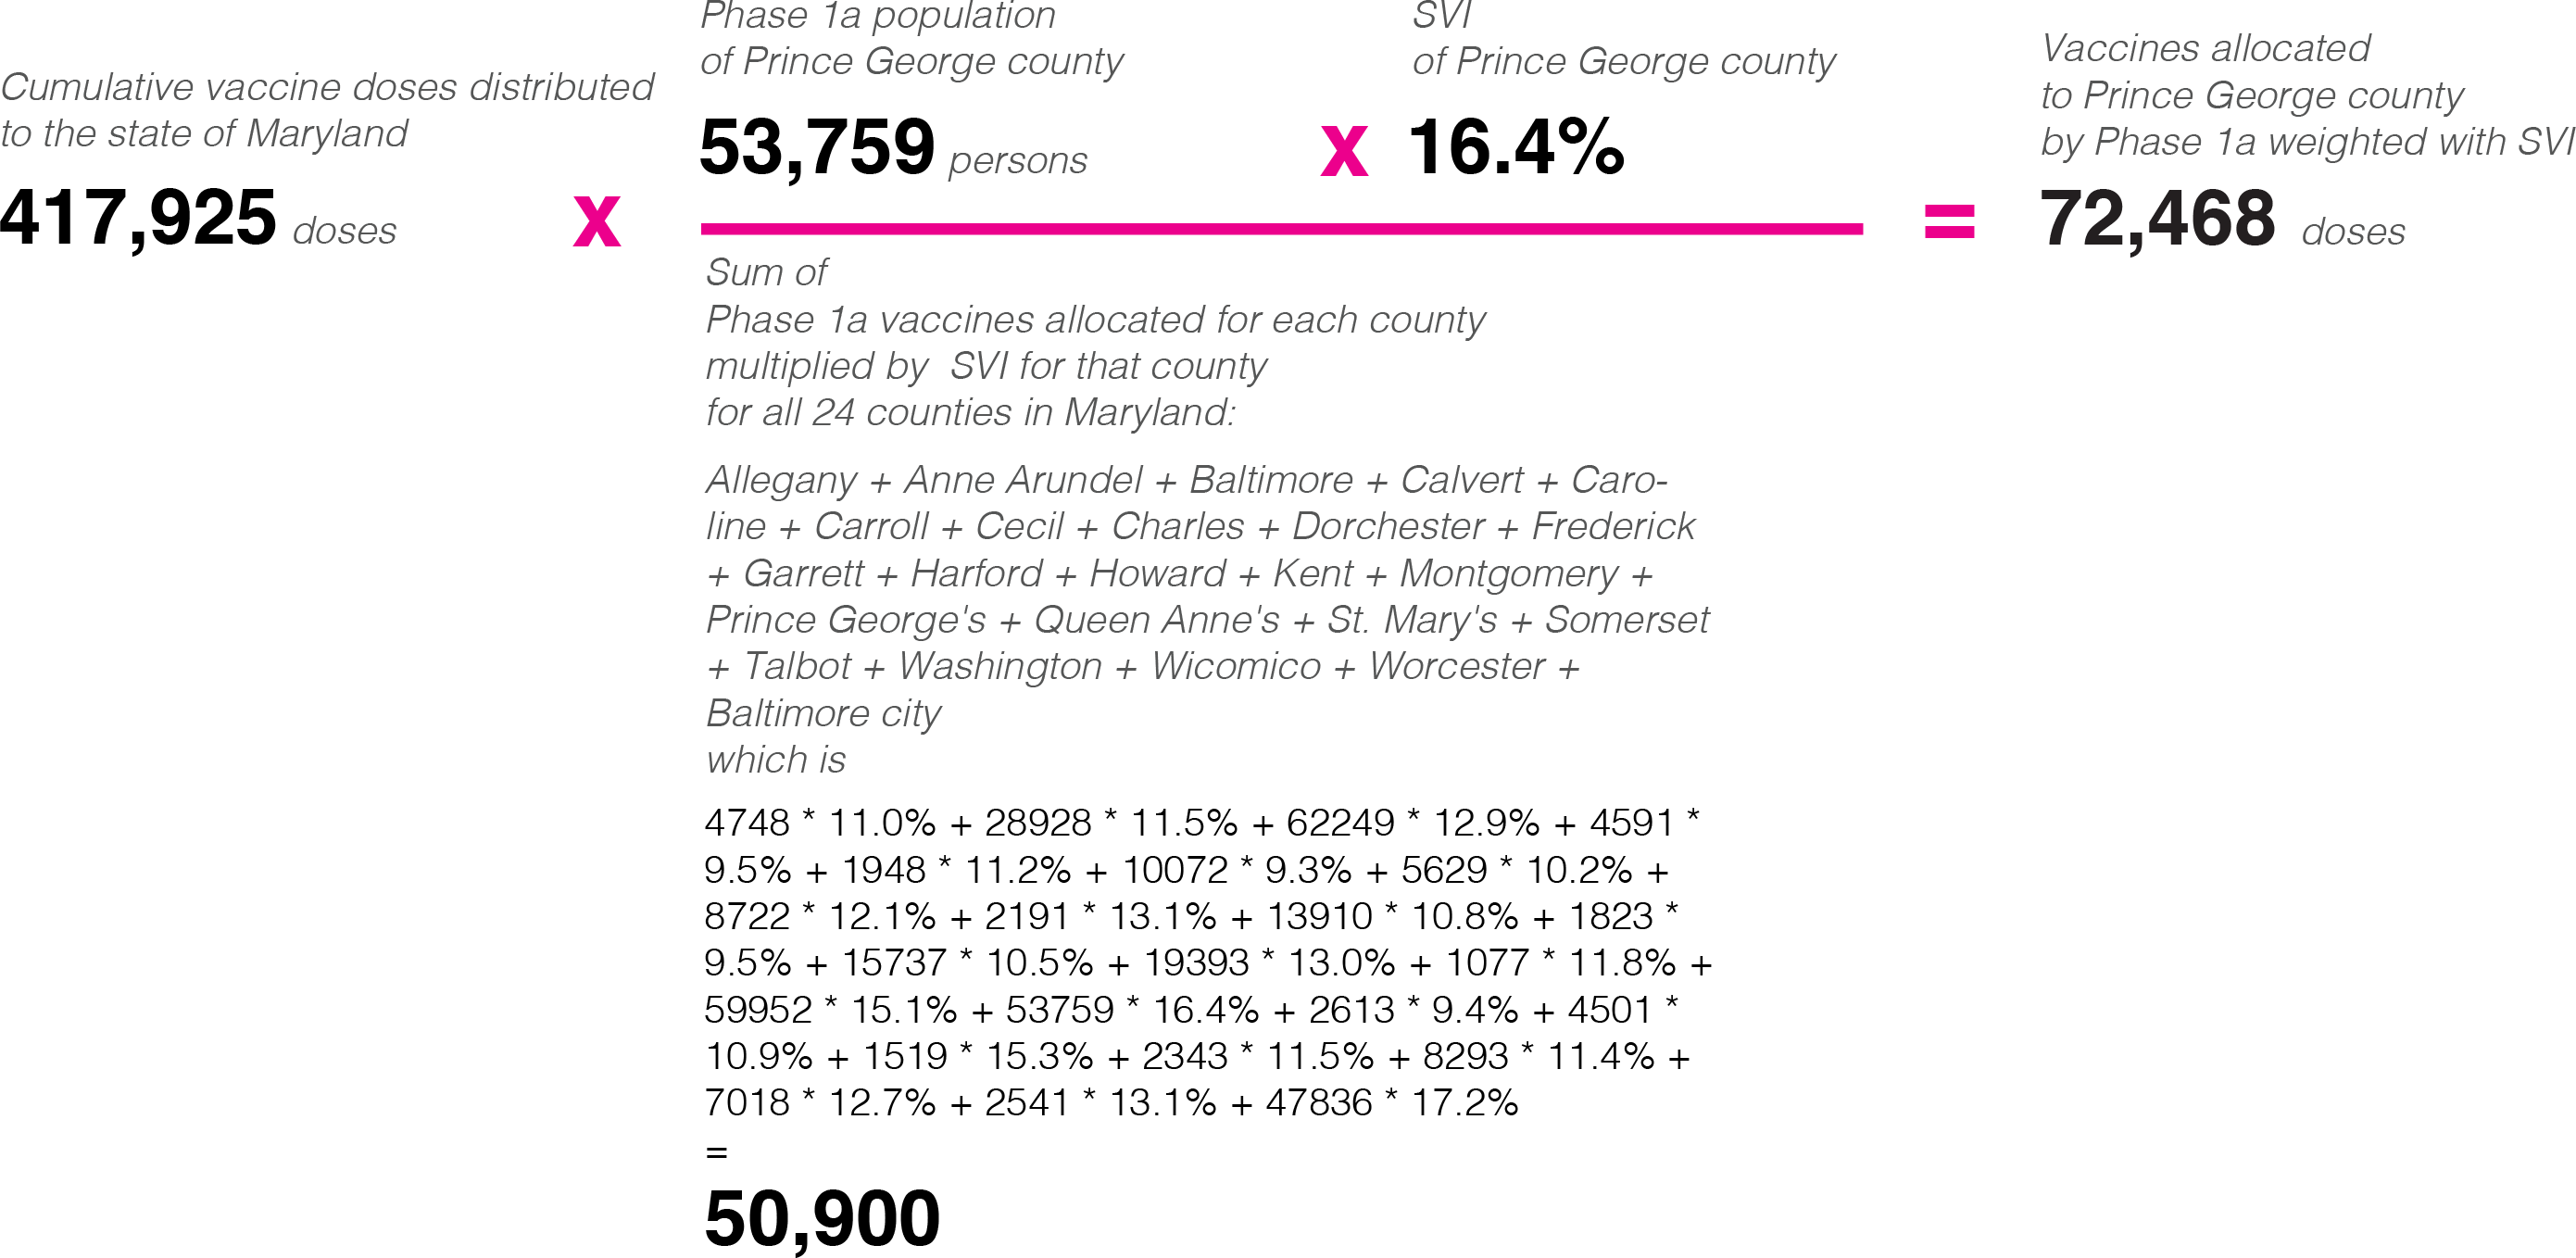
Phase 1a weighted by SVI
If doses were distributed in proportion Proportional to the county’s Phase 1a population weighted by SVI, Prince George’s would be allocated 72,468 doses (~17.3% of the state's total doses). Adding SVI SVI is factored in would give 11,974 doses to the county c Compared to allocating by just Phase 1a population , weighting Phase 1a by SVI increases the county’s allotment of doses by 11,974 (an increase of 19.8%)
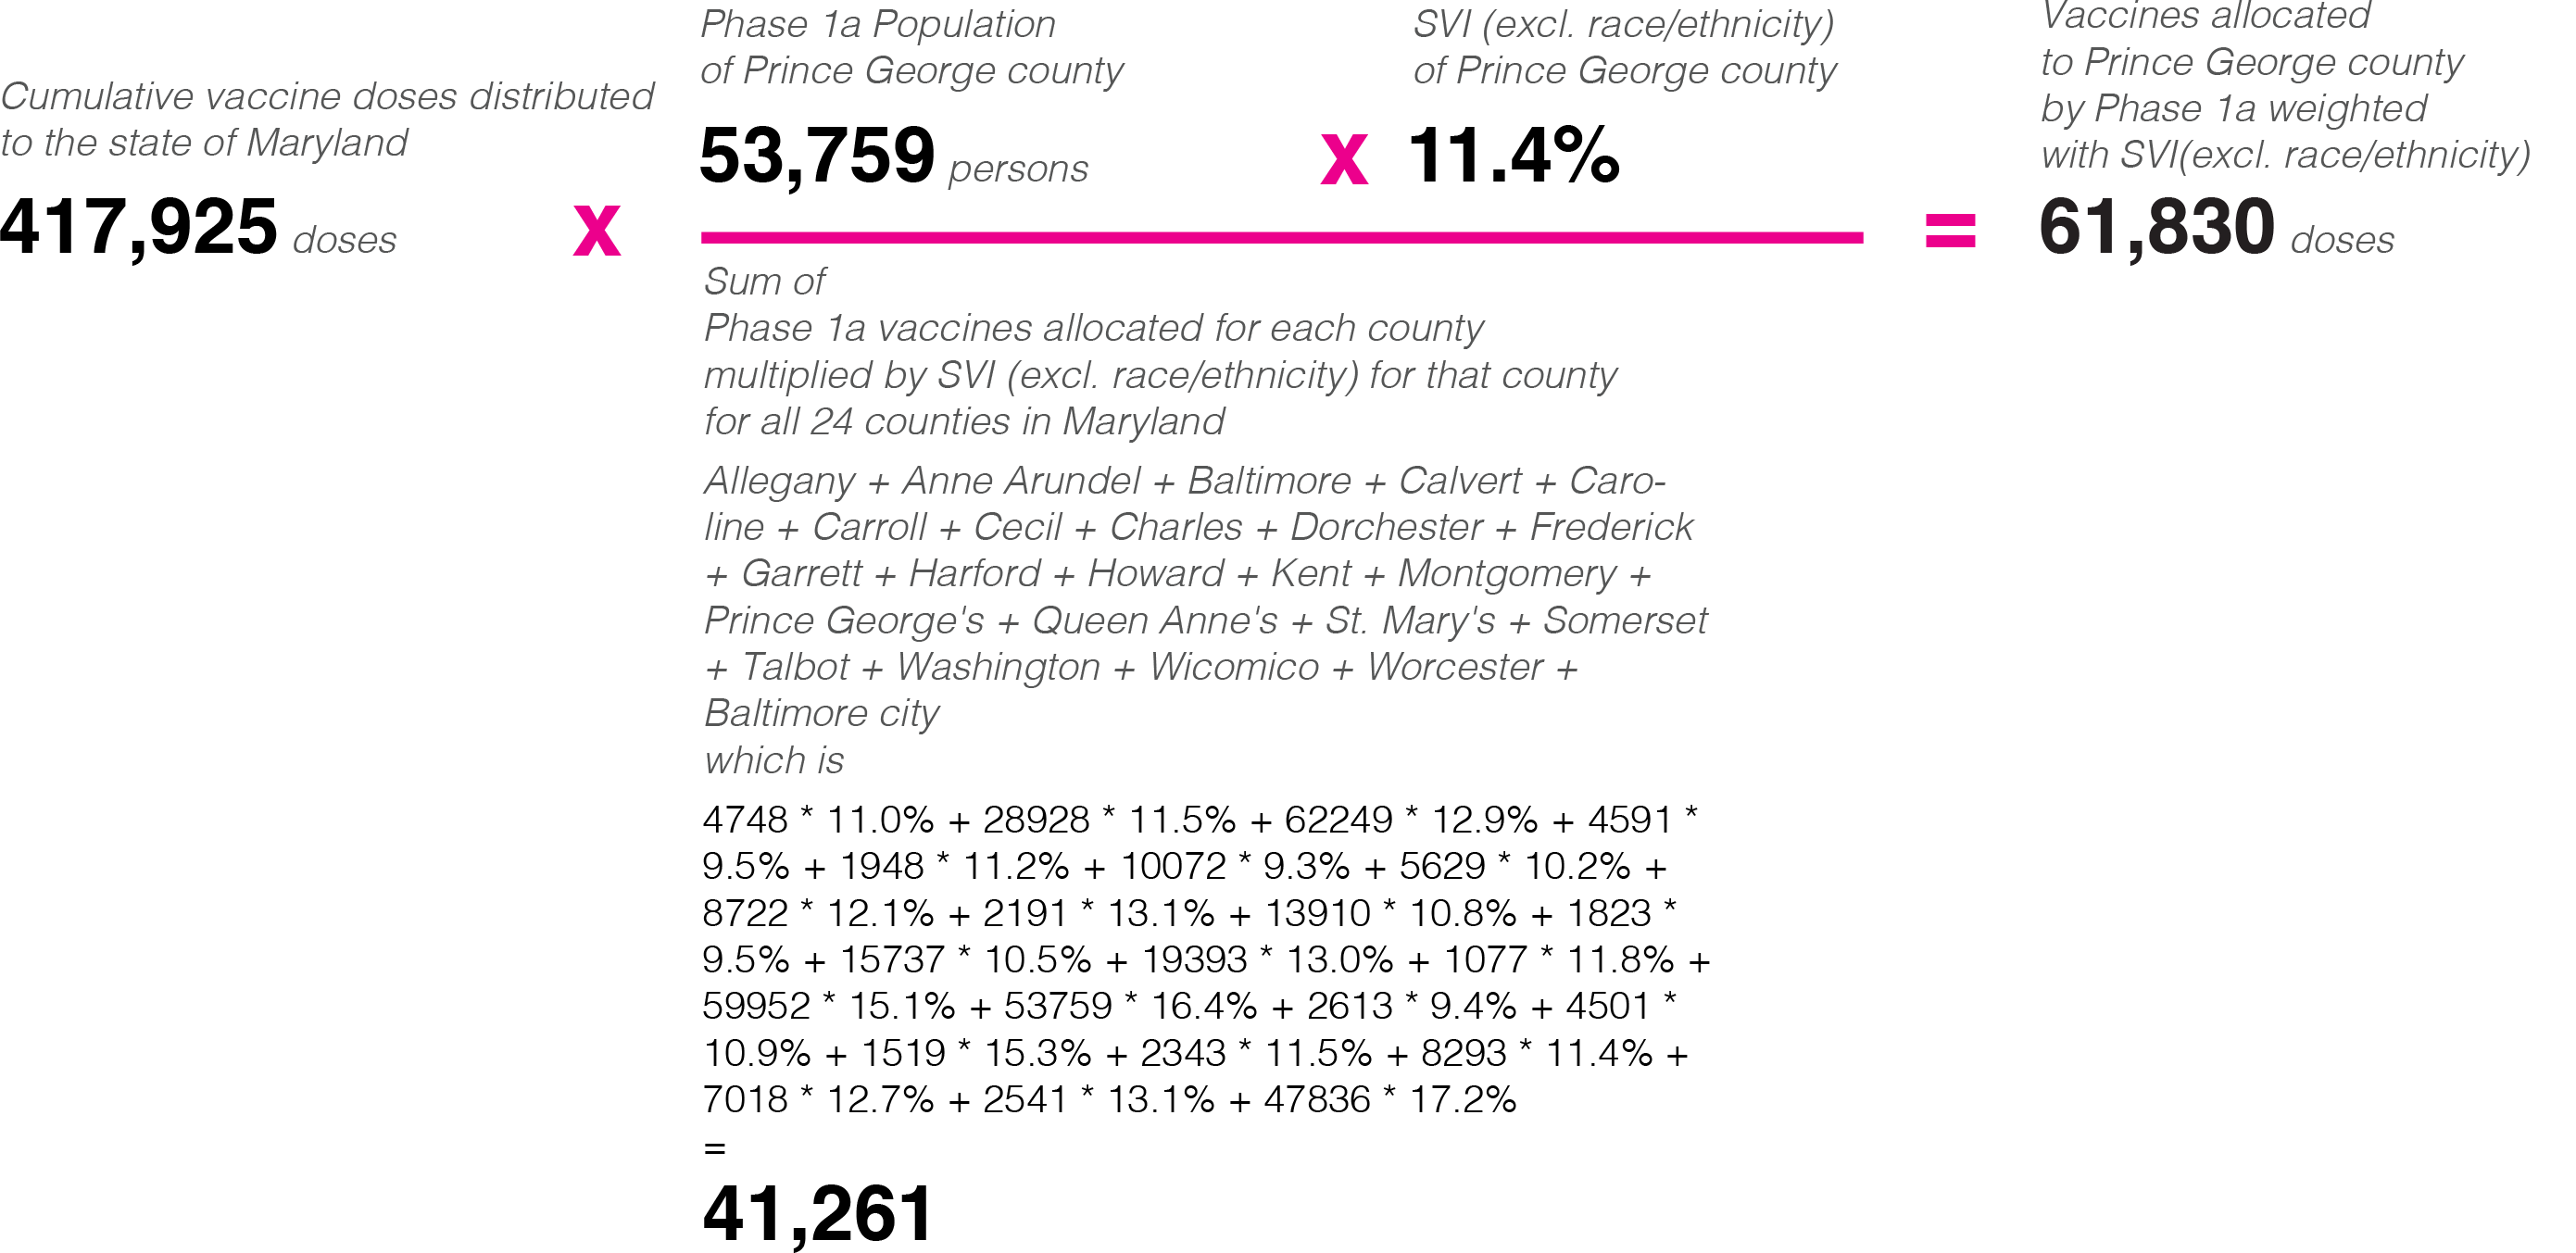
Phase 1a weighted by SVI vs Phase 1a weighted by SVI (excl. race/ethnicity)
If a modified SVI measure that excludes race and/or ethnicity is used to weight the Phase 1a population tBut if the SVI race and/or ethnicity factor is excluded from the Phase 1a weighting by SVI, then Prince George’s would be allotted only 61,830 doses (~14.8% of the state’s total doses). Compared to Phase 1a weighted by SVI, excluding the race and or ethnicity factor gives 10,638 fewer doses to the county decreases the doses the county would recieve by 10,638 (a decrease of-17.2%) due to Prince George’s larger proportion of non-white non-hispanic people—and returns its allocation to a level comparable with Phase 1a population alone (60,494 doses).
As the map shows, no scenario is neutral. Each prioritization reflects an explicit or implicit valuation, as well as the logistical challenges of distributing vaccine doses to hundreds of millions of Americans as quickly as possible. This project visualizes the differences and trade-offs between each of these choices in the hopes that a more nuanced understanding of the options will lead to more informed and ethical outcomes.
Indeed, even if we do not base dose allocations on prepandemic vulnerability directly, understanding who is likely to be left behind might enable states to make targeted investments in outreach, distribution facilities, and health-care capacity in order to mitigate the impact of existing inequality.
However, data from state health departments already show that vaccinations among Black Americans trail their white counterparts—even in the above population groups.
Vaccine distribution data are from the CDC’s COVID-19 Vaccine Distribution Allocations by Jurisdiction for the Pfizer11 and Moderna12 vaccines.
Adult population estimates are from the American Community Survey 5-Year Data (2015–2019) .
Health-care personnel estimates are from the 2018 Census Business Patterns (CBP),14 defined by Healthcare and Social Assistance Sector (NAICS 62) excluding Social Assistance (NAICS 624).
Long-term care facility (LTCF) residents estimates are from the Centers for Medicare & Medicaid Services (CMS) Provider Information dataset for nursing homes including rehab services.15
SVI rankings were estimated by applying the most recent SVI methodology16 to the American Community Survey 5-Year Data (2015–2019).17
- Executive Order 13962, 85 Fed. Reg. 79777 (December 12, 2020), https://www.federalregister.gov/documents/2020/12/11/2020-27455/ensuring-access-to-united-states-government-covid-19-vaccines.
- This map is a companion to our project Mapping the New Politics of Care: 1 Million Community Health Workers, which explores how community health workers (CHWs) might address both the immediate needs of communities during this pandemic as well as long-standing health disparities across the United States.
- These jurisdictions and agencies consist of the 50 states, six metropolitan cities, eight territories, and five federal agencies.
- Lisa Simunaci, “Pro Rata Vaccine Distribution Is Fair, Equitable,” Department of Defense News, December 11, 2020, https://www.defense.gov/Explore/News/Article/Article/2441698/pro-rata-vaccine-distribution-is-fair-equitable/.
- KFF’s State Health Facts. Data source: KFF analysis of state websites and COVID-19 vaccine plans, “State COVID-19 Vaccine Priority Populations,” https://www.kff.org/coronavirus-covid-19/issue-brief/the-covid-19-vaccination-line-an-update-on-state-prioritization-plans/.
- Centers for Disease Control and Prevention, “When Vaccine Is Limited, Who Should Get Vaccinated First?,” updated January 8, 2021, https://www.cdc.gov/coronavirus/2019-ncov/vaccines/recommendations.html.
- Formally, ACIP categorizes these considerations in the evidence tables of their recommendations as either scientific evidence of SARS-CoV-2 epidemiology (“Science”), vaccination program implementation (“Implementation”), and ethical principles (“Ethics”): maximize benefits and minimize harms, promote justice, mitigate health inequities, and promote transparency.
- Nancy McClung, Mary Chamberland, Kathy Kinlaw, Dayna Bowen Matthew, Megan Wallace, Beth P. Bell, Grace M. Lee, et al., “The Advisory Committee on Immunization Practices’ Ethical Principles for Allocating Initial Supplies of COVID-19 Vaccine—United States, 2020,” Morbidity and Mortality Weekly Report 69, no. 47 (2020): 1782, DOI: http://dx.doi.org/10.15585/mmwr.mm6947e3.
- Kathleen Dooling, Nancy McClung, Mary Chamberland, Mona Marin, Megan Wallace, Beth P. Bell, Grace M. Lee, H. Keipp Talbot, José R. Romero, and Sara E. Oliver, “The Advisory Committee on Immunization Practices’ Interim Recommendation for Allocating Initial Supplies of COVID-19 Vaccine—United States, 2020,” Morbidity and Mortality Weekly Report 69, no. 49 (2020): 1857, DOI: http://dx.doi.org/10.15585/mmwr.mm6949e1.
- National Academies of Sciences, Engineering, and Medicine, Framework for Equitable Allocation of COVID-19 Vaccine (Washington, DC: National Academies Press, 2020), https://doi.org/10.17226/25917.
- Centers for Disease Control and Prevention, “COVID-19 Vaccine Distribution Allocations by Jurisdiction - Pfizer,” 2020, https://data.cdc.gov/Vaccinations/COVID-19-Vaccine-Distribution-Allocations-by-Juris/saz5-9hgg.
- Centers for Disease Control and Prevention, “COVID-19 Vaccine Distribution Allocations by Jurisdiction - Moderna,” 2020, https://data.cdc.gov/Vaccinations/COVID-19-Vaccine-Distribution-Allocations-by-Juris/b7pe-5nws.
- US Census Bureau, “American Community Survey 5-Year Data (2015–2019),” 2020, https://www.census.gov/data/developers/data-sets/acs-5year.html.
- US Census Bureau, “2018 County Business Patterns,” 2020, https://www.census.gov/programs-surveys/cbp.html.
- Centers for Medicare and Medicaid Services, “Nursing homes including rehab services, Provider Information,” 2020, https://data.cms.gov/provider-data/dataset/4pq5-n9py.
- Centers for Disease Control and Prevention, “CDC Social Vulnerability Index (SVI),” September 4, 2020, https://www.atsdr.cdc.gov/placeandhealth/svi/index.html.
- US Census Bureau, “American Community Survey 5-Year Data (2015–2019),” 2020, https://www.census.gov/data/developers/data-sets/acs-5year.html.